Power BI and Tableau are two popular tools used by businesses to turn raw data into easy-to-understand visuals and analyses, helping organizations make better decisions. Both tools have strong features, but they work a bit differently.
Power BI is part of Microsoft’s suite of products, so it works well with other Microsoft programs like Excel and SharePoint. It covers everything from getting data ready to creating interactive reports and dashboards. Tableau, on the other hand, is known for its user-friendly drag-and-drop interface and advanced analytics, making it a favorite among data experts.
Choosing between Power BI vs Tableau is important because it affects how well your organization can use its data. You’ll need to consider things like what technology you already have, the skills of your team, your budget, and the kind of data you work with.
Picking the right tool means smoother workflows, better teamwork, and clearer insights for everyone involved. This helps your organization plan smarter and make decisions with confidence.
What is Power BI
Power BI is a really handy tool from Microsoft for understanding business information. It helps you see data in different ways, analyze it, and share what you find out.
– It’s easy to use.
– You can make your own dashboards to show what’s important to you.
– It can handle data that comes in really fast.
– You can work on projects with other people easily.
– There’s an app so you can check your data on your phone or tablet.
– It can use smart technology to help you understand your data better.
– It grows with your business.
– Coordinates well with other Microsoft programs.
What is Tableau
Tableau is a really strong tool for helping businesses understand their data better.
– Make helpful dashboards
– Work with lots of different types of data
– Connect to data that’s live or stored in memory
– Create really advanced charts and graphs
– Help people work together on projects
– Show data on maps and find where things are
– Let users interact with the content
– Look for trends and make predictions
– Connect with other software
– Control who can see and do things with the data
Data Modeling and ETL Capabilities
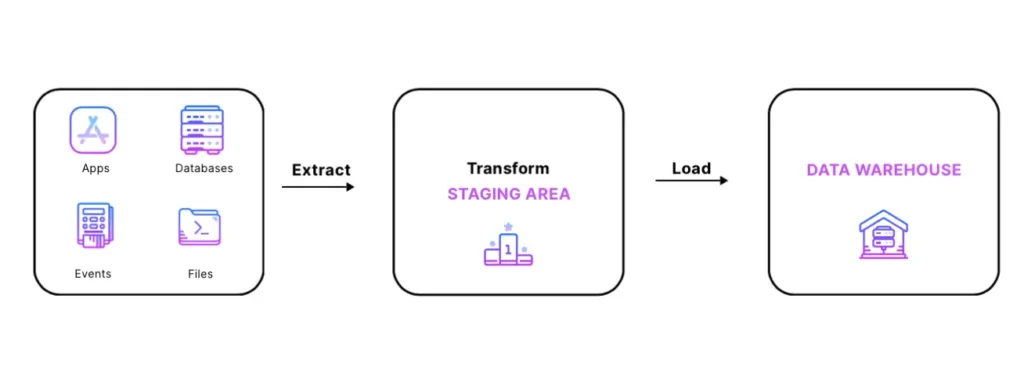
When we compare Power BI vs Tableau in terms of handling data modeling and ETL (Extract, Transform, Load), Power BI comes out ahead with its stronger features in this area. Power BI provides a robust set of tools for ETL tasks, allowing users to create reporting data sets without needing additional software. It supports a wide range of data sources and offers flexible options for transforming data through Power Query.
On the other hand, Tableau doesn’t have built-in ETL capabilities; instead, it relies on third-party tools or custom scripts for preparing data. However, Tableau is excellent at visualizing data and performs well with large data sets.
Deciding between Power BI vs Tableau for data modeling and ETL depends on the complexity of the data and how much customization is needed.
Collaboration and Sharing
Both Power BI and Tableau have strong features for working together and sharing information. With Power BI, you can quickly make and share reports, securely publish them to the cloud, and easily add reports into websites or apps. On the other hand, Tableau needs workbooks and dashboards to be put on Tableau Server, Tableau Online, or Tableau Public before they can be shared. Even though both platforms let you share and comment on data, Power BI gives you more flexibility and options for sharing data compared to Tableau. Power BI vs Tableau analysis is based on your specific business needs, how much money you can spend, and how much data you have to handle.
Mobile App Functionality

When comparing ‘Power BI vs Tableau,’ one aspect to consider is their mobile app functionality. Power BI offers a strong mobile version for both iOS and Android devices, allowing users to easily access reports and dashboards on the go. Even though Power BI’s mobile app has a standard screen size for all device types, it still provides a convenient way to stay updated.
Tableau’s mobile app has fewer features, primarily focusing on viewing reports and dashboards rather than extensive editing capabilities. Users who want more advanced mobile features might prefer Power BI.
For users seeking a complete mobile experience, Power BI could be a better choice. Tableau’s mobile app might be sufficient for those who simply need a straightforward way to view reports and dashboards.
Integration with Data Sources
We may conclude from the Power BI vs Tableau analysis is that both tools are great at working with lots of different types of data sources. They let users connect to many databases, cloud services, and types of files. With Power BI, it’s easy to connect to Microsoft stuff like Excel and Azure services. Tableau also has strong connections to lots of different data sources, so users can mix and analyze data from different places really well.
Pricing Structure
Another important difference to note between Power BI and Tableau is how they charge for their services. They have different pricing models tailored to suit various needs and preferences. Power BI provides several options: Power BI Desktop, which is free. Power BI Pro, priced at $9.99 per user per month; and Power BI Premium, whose cost varies depending on usage.
Tableau has its own set of options: Tableau Creator (which costs $70 per user every month), Tableau Explorer (which costs $35 per user every month), and Tableau Viewer (which costs $12 per user every month). These options are part of a plan where you pay every month.
For smaller groups or individuals, Power BI might be better because it’s cheaper. But Tableau has different levels of cost and features.
Customization Options
When you look at customizing options in Power BI vs Tableau, you’ll find they both offer flexibility, but each has its own strengths:
Power BI is praised for being easy to use with its simple interface. It gives users lots of ways to customize without needing to be super technical. You can tweak visualizations and layouts without a lot of hassle.
Tableau stands out for its fancy visualizations and flexibility. It lets you create really detailed and personalized designs.
Both tools work well, but they suit different tastes and levels of expertise when it comes to making data visualizations and dashboards your own.
Factors Influencing Choice Between Power BI vs Tableau

Deciding between Power BI vs Tableau depends on several important factors that affect how well each platform fits an organization’s specific needs.
For companies already using Microsoft technologies, Power BI may be preferred because it integrates tightly with other Microsoft products. On the other hand, organizations not tied to Microsoft might favor Tableau for its independence.
Both tools support various data source types, but there are differences in connectors and ease of use with certain databases. For example, Tableau has historically had better connections to Oracle databases compared to Power BI.
Tableau offers more advanced statistical functions and predictive modeling capabilities, making it a top choice for data science teams. Power BI is catching up with its AI and ML features, narrowing this gap over time.
While both tools offer extensive visualization options, Tableau tends to offer more customization for complex charts and graphs. Power BI, on the other hand, excels at standard chart types and dashboard layouts.
Power BI generally has a simpler user interface, making it easier for non-technical users to learn quickly. Tableau requires more technical expertise and understanding of data manipulation concepts.
Power BI often comes included with many Microsoft subscriptions, whereas Tableau charges separately for licenses.
The current skill set within an organization also plays a role in choosing between Power BI and Tableau. If most employees are already familiar with Power BI, switching to Tableau would likely require retraining.
For large enterprises dealing with massive amounts of data, Tableau’s superior performance capabilities may be beneficial, especially for handling complex calculations and queries.
Power BI vs Tableau depends on carefully considering these factors and aligning them with the organization’s goals and objectives.

